
Results 1,601 to 1,620 of 2141
Thread: Instaforex Analysis
-
09-12-21, 07:12 #1601
 Veteran Member
Just starting here
Veteran Member
Just starting here

- Join Date
- Jun 2013
- Age
- 38
- Posts
- 4,044
- Rep Power
- 0

Forex Analysis & Reviews: Forecast for USD/JPY on December 9, 2021
Yesterday the Japanese yen traded in a range of 65 points, but the day was closed with a white candle and settling above the daily MACD line (blue sliding line) was confirmed.
The Marlin Oscillator is approaching the border with the growth territory. This is a sign that the signal level of 113.96 (yesterday's high) is technically increasing its value - crossing and settling on it can be synchronized in time with the oscillator's transition to the positive area, which will strengthen the upward potential. The target for growth is the 115.80-116.15 range. Returning under the price channel line (113.21) will provoke an attack on the bearish signal level of 112.54, the crossing of which, in turn, will direct the price to the lower line of the price channel of 110.77.
On the four-hour scale chart, the price settled above the MACD indicator line, the Marlin Oscillator is in a sideways local trend, but in the zone of positive values. The probability of further growth is 70%.
Analysis are provided by InstaForex
-
10-12-21, 07:32 #1602
Veteran Member
Just starting here
- Join Date
- Jun 2013
- Age
- 38
- Posts
- 4,044
- Rep Power
- 0
Forex Analysis & Reviews: AUDUSD bullish breakout | 10th Dec 2021
The wandering nature of the euro, which we talked about in yesterday's review, is gaining confirmation this morning. The daily scale Marlin Oscillator begins chaotic movements along the zero line, approximately as it was in the third decade of October (gray rectangle). Therefore, we can take the price movement to 1.1415 and to 1.1170 equally probable. Taking into account the current downward trend, which has been going on since May, the probability of a downward trend is 55%. Of course, surpassing the target level of 1.1415 and the MACD line will direct the euro into medium-term growth.
On the four-hour chart, the price is being held by the MACD indicator line, the Marlin Oscillator has penetrated the bears' territory. If the price moves below yesterday's low (1.1278), it will also correspond to its decline below the MACD line, which will increase the probability of price movement to the lower target of 1.1170 to 75%.
Analysis are provided by InstaForex
-
13-12-21, 09:11 #1603
Veteran Member
Just starting here
- Join Date
- Jun 2013
- Age
- 38
- Posts
- 4,044
- Rep Power
- 0
Forex Analysis & Reviews: EUR/USD Indicator Analysis; Daily review for December 13, 2021
Trend analysis (Fig. 1).
The market may move down on Monday from the level of 1.1314 (closing of Friday's daily candle) with the target at 1.1246, the support line (blue bold line). When testing this line, the price may continue to move upward with the target at 1.1306, the 23.6% retracement level (blue dashed line).
Fig. 1 (daily chart)
Comprehensive analysis:
- Indicator analysis - down;
- Fibonacci levels - down;
- Volumes - down;
- Candlestick analysis - down;
- Trend analysis - up;
- Bollinger lines - down;
- Weekly chart - down.
General conclusion:
The price may move down from the level of 1.1314 (closing of Friday's daily candle) with the target at 1.1246, the support line (blue bold line). When testing this line, the price may continue to move upward with the target at 1.1306, the 23.6% retracement level (blue dashed line).
Unlikely scenario: the price may start moving up from the level of 1.1314 (closing of Friday's daily candle) with the target at 1.1354, the upper fractal (red dotted line). When testing this level, the price may continue to move upward with the target at 1.1378, the 38.2% retracement level (blue dashed line).
Analysis are provided by InstaForex
-
14-12-21, 08:45 #1604
Veteran Member
Just starting here
- Join Date
- Jun 2013
- Age
- 38
- Posts
- 4,044
- Rep Power
- 0
Forex Analysis & Reviews: Technical analysis for EUR/USD on December 14, 2021
Trend analysis (pic. 1).
Today, the pair has dropped from the level of 1.1283 (the closing of yesterday's daily candlestick). It may reach the support level of 1.1249 (the blue bold line). When testing this level, it is likely to rebound to the retracement level of 23.6% - 1.1305 (blue dotted line). After that, the pair may climb higher.
Pic. 1 (daily chart).
Complex technical analysis:
- technical indicator analysis - down;
- Fibonacci retracement levels - down;
- trading volumes - down;
- candlestick analysis - up;
- trend analysis - up;
- Bollinger bands - down;
- weekly chart-up.
Conclusion:
Today, the price from the level of 1.1283 (closing of yesterday's daily candle), moving down, will try to reach the support line - 1.1249 (blue bold line). When testing this line, it is possible to move up in order to reach the pullback level of 23.6% - 1.1305 (blue dotted line), most likely, after that the price will go further up.
Alternatively, the pair may try to resume the downward movement from the 1.1283 level (closing of yesterday's daily candlestick) with the target level of 1.1249. It also acts as a support (blue bold line). Having tested this level, the pair is likely to decline to the target level of 1.1227, the bottom line (red dotted line).
Analysis are provided by InstaForex
-
16-12-21, 06:24 #1605
Veteran Member
Just starting here
- Join Date
- Jun 2013
- Age
- 38
- Posts
- 4,044
- Rep Power
- 0
Forex Analysis & Reviews: Forecast for USD/JPY on December 16, 2021
The dollar strengthened against the yen by 0.32% (35 points) on Wednesday following the US Federal Reserve meeting. The price broke the signal level of 113.96, crossed the indicator line of the daily scale balance, displacing the market interest in buying, and now its target is 115.80-116.15. The Marlin Oscillator supports this price plan by moving into an upward trend area.
On the chart of a four-hour scale, the price is in an upward trend by all indications: its development goes above the indicator lines, Marlin is in the positive area.
*The market analysis posted here is meant to increase your awareness, but not to give instructions to make a trade.
Analysis are provided by InstaForex
-
20-12-21, 06:35 #1606
Veteran Member
Just starting here
- Join Date
- Jun 2013
- Age
- 38
- Posts
- 4,044
- Rep Power
- 0
Forex Analysis & Reviews: Trading signals for CRUDE OIL on December 20 - 21, 2021: buy above 68,75 (2/8)
The oil price (WTI- #CL) kicked off this week with a bearish gap and approached the low of 68,75. The 2/8 Murray zone is strong support for crude oil. It is expected for the next few days to bounce above this level with targets at the 21 SMA located at 70,77.
The International Energy Agency (IEA) downgraded the outlook for oil demand by around 100,000 barrels per day for both 2021 and 2022, citing the emergence of the Omicron variant weighing on global oil demand.
A surplus in oil inventories of 1.7 million barrels per day could materialize in the first quarter of 2022, an oil surplus of 2 million barrels per day could materialize in the second quarter of 2022.
According to the IEA report, global supply could skyrocket by 6.4 million barrels per day next year compared to an increase of 1.5 million barrels per day in 2021.
In the medium term, oil could be under downward pressure. If inventories continue to increase in the market, the oil price could decline more to the psychological level of 50,00.
On the chart, we can see that oil is trading below the 200 EMA located at 73,55 and below the 21 SMA at 70,77. This technical data provides the negative outlook for oil, which we could expect to fall in the next few days towards 65,62 and even more to the low of December 2 at 62,40.
Our trading plan is to buy as long as it remains above 2/8 Murray, with the target at SMA of 21 at 70,77. Friday's gap at the close of Friday will be covered. A consolidation above 70.77 could boost the recovery of oil to the level of 200 EMA at 73,55.
Conversely, a daily close below 68,40 could quickly accelerate the WTI decline. The objective will be to cover the gap that remains open at 65,62 if the downward pressure prevails up to 62,40. The eagle indicator continues to give the negative signal. It is likely that it could continue the fall in the coming days.
Support and Resistance Levels for December 20 - 21, 2021
Resistance (3) 70,76
Resistance (2) 70,19
Resistance (1) 69,32
----------------------------
Support (1) 68,72
Support (2) 67,97
Support (3) 67,01
************************************************** *********
A trading tip for WTI on December 20 - 21, 2021
Buy above 68,75 (2/8) with take profit at 70,77 and 73,55 (200 EMA), stop loss below 68,30.
*The market analysis posted here is meant to increase your awareness, but not to give instructions to make a trade.
Analysis are provided by InstaForex
-
21-12-21, 05:57 #1607
Veteran Member
Just starting here
- Join Date
- Jun 2013
- Age
- 38
- Posts
- 4,044
- Rep Power
- 0
Forex Analysis & Reviews: Forecast for EUR/USD on December 21, 2021
The euro rose by 37 points on Monday, extending the lateral movement in time from the 7th. The Marlin Oscillator continued to form the pattern of the third decade of October (gray area). Then, after the sideways trend of the oscillator, the price fell, a similar outcome is likely in the current situation.
The four-hour chart shows a correctional price rebound from the support area on December 7 and 16, which was expected yesterday. The balance indicator line stopped the price's growth, while the oscillator's growth was stopped by its own zero line - the border with the bulls' territory. Now we are waiting for a repeated attack on the support area on December 7 and 16 (1.1225/40), surpassing it and further decline to the first target level of 1.1170, then to 1.1050.
Analysis are provided by InstaForex
-
22-12-21, 08:10 #1608
Veteran Member
Just starting here
- Join Date
- Jun 2013
- Age
- 38
- Posts
- 4,044
- Rep Power
- 0
Forex Analysis & Reviews: Elliott wave analysis of EUR/JPY for December 22, 2021
EUR/JPY is clearly in its final stages of the correction near wave 4/. All we need is a break above minor resistance at 129.64 to confirm that wave 4/ is completed and wave 5/ of 3 is in motion towards at least 135.04 and possibly even closer to the 139.70 target. This will complete wave 3 and set the stage for another wave 4 correction,. However, first we need to stay alert to signs that wave 4/ is completed and wave 5/ is in motion. The best thing that can happen is a break above minor resistance at 129.64 to confirm that wave 5/ is in motion.
*The market analysis posted here is meant to increase your awareness, but not to give instructions to make a trade.
Analysis are provided by InstaForex
-
23-12-21, 06:46 #1609
Veteran Member
Just starting here
- Join Date
- Jun 2013
- Age
- 38
- Posts
- 4,044
- Rep Power
- 0
Forex Analysis & Reviews: Forecast for EUR/USD on December 23, 2021
Yesterday, the euro decided to choose an upward direction, intending to complicate and lengthen the horizontal movement, which began on November 29-30. There are about 20 points until the resistance of the MACD line (1.1363), and without breaking the main scenario and its own sideways movement, it is likely that the price will turn down from this resistance. If it overcomes the 1.1363 level, the main scenario will change to a price reversal from the target level of 1.1415. But if the price settles above 1.1415, then an alternative scenario will take effect with the price rising to the target level of 1.1572 (the January 2019 high).
An interesting situation develops on the Marlin Oscillator. Yesterday's exit of the signal line from the rectangular area of consolidation, marked with a gray area, repeats the exit of the signal line from the same consolidation on October 28 - it is marked with a red oval. And, as you can see, after the signal line returned to the range, the price fell.
On the four-hour chart, the price settled above the MACD line, Marlin is confidently rising in the positive area - the situation is upward. Probably, the price will decide to test the strength of the resistance range of 1.1363-1.1415.
Analysis are provided by InstaForex
-
24-12-21, 07:06 #1610
Veteran Member
Just starting here
- Join Date
- Jun 2013
- Age
- 38
- Posts
- 4,044
- Rep Power
- 0
Forex Analysis & Reviews: US shares higher at close of trade; Dow Jones up 0.55%
At the close in New York, the Dow Jones gained 0.55%, the S&P 500 rose 0.62% and the NASDAQ Composite rose 0.85%.
In the leaders of growth among the components of the Dow Jones at the end of today's trading were shares of Caterpillar Inc, which increased in price by 4.05 points (2.00%), to close at around 206.20. Dow Inc added 1.68% or 0.91 points to end trade at 55.14. Honeywell International Inc rose 1.67% or 3.38 points to close at 205.22.
The biggest losers were Visa Inc Class A, which fell 0.61% or 1.34 points to end the session at 216.62. Merck & Company Inc is up 0.56% or 0.43 points to end at 75.73 and Walmart Inc is 0.22% or 0.31 points down to 139. , 49.
The leaders of growth among the components of the S&P 500 at the end of today's trading were Tesla Inc, which rose 5.76% to 1.067.00, ViacomCBS Inc, which gained 4.80% to close at 30.58, and shares Micron Technology Inc rose 4.52% to end the session at 94.42.
The biggest losers were Coterra Energy Inc, which fell 1.82% to close at 19.39. Hologic Inc shed 1.42% to end the session at 76.12. Pfizer Inc was down 1.41% to 58.71.
The growth leaders among the components of the NASDAQ Composite index at the end of today's trading were shares of 22nd Century Group Inc, which rose 38.64% to the level of 3.050, Oncology Institute Inc, which gained 38.46%, to close at 10.44, and Pasithea Therapeutics Corp rose 36.73% to trade at 2.01 at the close.
The biggest losers were InnovAge Holding Corp, which fell 35.64% to close at 5.31. Jupiter Wellness Inc shed 24.89% to trade at 0.954. American Virtual Cloud Technologies Inc was down 24.00% to 1,900.
On the New York Stock Exchange, the number of securities that went up (2,289) exceeded the number of securities that closed in the red (971), while the quotations of 126 shares remained virtually unchanged. On the NASDAQ stock exchange 2679 companies rose in price, 1163 declined, and 181 remained at the level of the previous close.
The CBOE Volatility Index, which is based on S&P 500 options trading, fell 3.60% to 17.96, hitting a fresh monthly low.
Gold Futures for February delivery was up 0.42% or 7.65 to $ 1.809.85 a troy ounce. Elsewhere, WTI crude for February delivery rose 1.32%, or 0.96, to $ 73.72 a barrel. Futures contracts for Brent oil for March delivery rose 0.01%, or 0.01, to trade at $ 76.61 a barrel.
Meanwhile, on the Forex market, EUR / USD was up 0.03% to hit 1.1331, while USD / JPY was up 0.04% to hit 114.41.
The US Dollar Index Futures was down 0.02% at 96.035.
Analysis are provided by InstaForex
-
27-12-21, 08:11 #1611
Veteran Member
Just starting here
- Join Date
- Jun 2013
- Age
- 38
- Posts
- 4,044
- Rep Power
- 0
Forex Analysis & Reviews: Forecast for EUR/USD on December 27, 2021
The euro opened the last trading week of 2021 in the upper half of the monthly range, before the resistance of the MACD line on the daily scale chart (1.1355). The price's exit above this resistance will open the nearest target of 1.1415. This is possible even today because of the thin market - UK investors are resting, but if American players wanted to go above 1.14, they would have already done it under more favorable circumstances. Now, if you use the thin market for strategic purposes, it is more convenient to strengthen the dollar. Or not to take any action, that is, to remain sideways until January, until the United States clarifies its geopolitical goals. Situationally, it turns out that it is more profitable to buy dollars. For this case, the 1.1170 target is always open.
According to the Marlin Oscillator, a reversal pattern remains, repeating the technical pattern of October-November 2021 - the signal line of the oscillator may return to the side range marked with a gray rectangle and go down from it.
*The market analysis posted here is meant to increase your awareness, but not to give instructions to make a trade.
Analysis are provided by InstaForex
-
28-12-21, 07:25 #1612
Veteran Member
Just starting here
- Join Date
- Jun 2013
- Age
- 38
- Posts
- 4,044
- Rep Power
- 0
Forex Analysis & Reviews: Forecast for EUR/USD on December 28, 2021
For the fourth day, the euro is moving in a narrow sideways direction under the MACD indicator line on the daily scale chart. And the longer this sideways trend lasts, the more likely the price will break above this indicator line (1.1350). The signal line of the Marlin Oscillator moves strictly horizontally above the consolidation range marked with a gray rectangle, which ultimately creates a forecast for the following technical picture: the price will break above the MACD line (1.1350), but for a very short time, return below it, the Marlin Oscillator will return to its own consolidation and the price will continue to decline towards the target of 1.1170. In this case, the target level 1.1415 may not be reached. But if the euro is able to overcome the situation, breaks above 1.1415, then further growth will continue to the target level of 1.1572.
On the four-hour scale chart, the price settled above the MACD line, the Marlin Oscillator, after a false move into the negative zone, returned to the positive area. These are signs that the price is preparing to jump up to the 1.1350 resistance with the intention of breaking it.
*The market analysis posted here is meant to increase your awareness, but not to give instructions to make a trade.
Analysis are provided by InstaForex
-
29-12-21, 06:21 #1613
Veteran Member
Just starting here
- Join Date
- Jun 2013
- Age
- 38
- Posts
- 4,044
- Rep Power
- 0
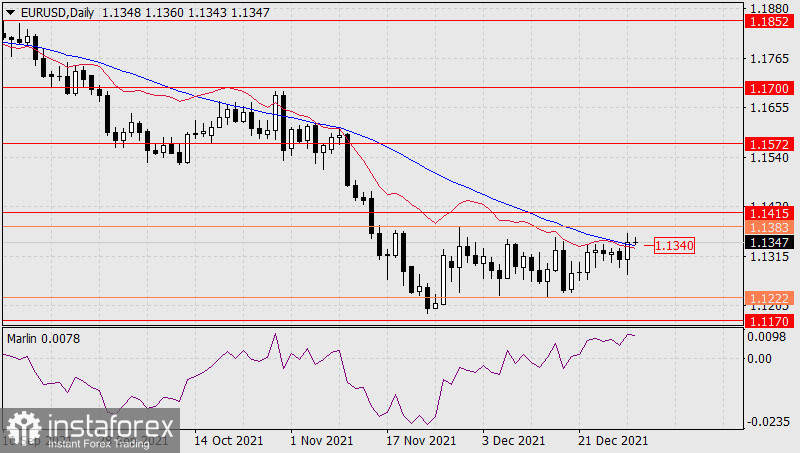
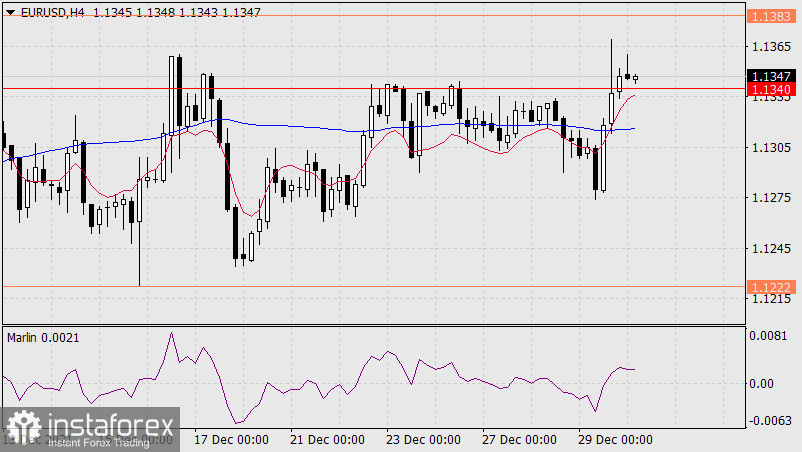
Forex Analysis & Reviews: Forecast for EUR/USD on December 29, 2021
Over the past day, the price of the single European currency has outlined a tendency to move away from the MACD indicator line on the daily scale chart.
The price does not dare to test the strength of the resistance formed by the merger of two indicator lines - the balance line and the MACD line (1.1345). The signal line of the Marlin Oscillator returns to the range of December 8-21, marked on the oscillator chart with a gray rectangle. The price probably decided to choose the path of less resistance and headed towards the first bearish target of 1.1170. The probability of surpassing the area above the resistance level of 1.1345 has become noticeably lower.
On the four-hour chart, the price returned under the MACD line and managed to settle below it. The price also crossed the balance indicator line. The Marlin Oscillator is in a downward trend zone. The descending scenario becomes the main one. *The market analysis posted here is meant to increase your awareness, but not to give instructions to make a trade.
Analysis are provided by InstaForex
-
30-12-21, 12:08 #1614
Senior Member
Just starting here
- Join Date
- Jul 2013
- Age
- 39
- Posts
- 112
- Rep Power
- 0
Forecast for EUR/USD on December 30, 2021
Yesterday the euro traded in a range of more than 90 points, overcoming the resistance of the balance and MACD indicator lines at the end of the day. An unpleasant surprise did take place.
But we are in no hurry to announce that the price will mark near any bullish target level, and here the nearest target is 1.1415. The signal line of the Marlin Oscillator can turn down, and the price can just as easily return to yesterday's low. The reason for this will be the fact that the euro grew without a pronounced risk appetite in adjacent markets. US stocks showed mixed closings. US government bonds have undergone sales, but this trend has been going on for ten days and raises new questions - where does the money go from the US market? There is no answer to this question yet. The Treasury is rapidly increasing its debt and formally this should keep the demand for the dollar. The current debt is 29.443 trillion dollars. In the end, the euro has been moving sideways for a month, and until the price breaks out of this sideways side (1.1222-1.1383), it is too early to link the euro's movements with external events.
On the four-hour chart, the indicator of the Marlin Oscillator moves horizontally, the price periodically goes above and below the line. The Marlin Oscillator is also in a wide-range sideways trend, at the moment it shows an intention to turn down from the positive area.
So, yesterday's rise in prices showed the uncertainty of the euro. And no one knows when it will end. January and February can be challenging geopolitically.
*The market analysis posted here is meant to increase your awareness, but not to give instructions to make a trade.
-
31-12-21, 08:20 #1615
Veteran Member
Just starting here
- Join Date
- Jun 2013
- Age
- 38
- Posts
- 4,044
- Rep Power
- 0
Forex Analysis & Reviews: USDCAD, Bearish Pressure | 31st Dec 2021
On the H4, with price breaking the ascending trendline at 1st resistance of 1.27676 which is in line with horizontal overlap resistance, price can potentially drop to 1st support at 1.26839, which is in line with horizontal swing low support, 78.6% Fibonacci retracement level. Alternatively, price may rise up to 2nd resistance at 1.2832, which coincides with horizontal swing high resistance, 38.2% Fibonacci retracement level . This is further supported by how price is now holding below the Ichimoku cloud resistance.
Trading Recommendation
Entry: 1.27676
Reason for Entry:
Horizontal overlap resistance, Ascending trendline breakout
Take Profit: 1.26839
Reason for Take Profit:
Horizontal swing low support, 78.6% Fibonacci retracement level
Stop Loss: 1.2832
Reason for Stop Loss:
Horizontal swing high resistance, 38.2% Fibonacci retracement level
Analysis are provided by InstaForex
-
03-01-22, 07:15 #1616
Veteran Member
Just starting here
- Join Date
- Jun 2013
- Age
- 38
- Posts
- 4,044
- Rep Power
- 0
Forex Analysis & Reviews: Forecast for EUR/USD on January 3, 2022
The euro rose by 64 points on Friday, the last day of 2021. It tested the signal level of 1.1383, and this morning it is moving down from it. A reversal under the MACD line, below 1.1333, will set the downward momentum to the lower border of the free roaming range (1.1222).
On the four-hour chart, the price is developing in a growing position, since the price is above the balance (red) and MACD (blue) indicator lines. The MACD line is an indicator of the local trend, and it generally moves horizontally.
In this case, the main indicator of market sentiment will be price taking above or below this line with a confirmation signal from the Marlin Oscillator. At the moment, we see a signal for growth, but Marlin began to show a downward reversal almost vertically, this is a sign of price attack on support (1.1333). And since the MACD line (1.1316) is located below the level of 1.1333, then for the complete formation of conditions for a decline, it is necessary to consolidate below this indicator line.
An exit above 1.1383 could create a reactionary rally towards the 1.1415 target level. Consolidating above it will become a condition for further growth to the level of 1.1570 (January 2019 high).
*The market analysis posted here is meant to increase your awareness, but not to give instructions to make a trade.
Analysis are provided by InstaForex
-
04-01-22, 06:59 #1617
Veteran Member
Just starting here
- Join Date
- Jun 2013
- Age
- 38
- Posts
- 4,044
- Rep Power
- 0
Forex Analysis & Reviews: Forecast for EUR/USD on January 4, 2022
Finally, the euro has made its choice. Yesterday, on solid volumes (despite the fact that there was a day off in Japan and Great Britain), the price went under the daily-scale balance and MACD indicator lines, and this movement was the largest since November 26 (but then there was a price increase). Now the euro is facing the nearest target of 1.1170, but such a powerful start clearly indicates that the target is deeper, for example, 1.1050 - the high of March and December 2015.
On the four-hour scale chart, the price also went under the balance and MACD indicator lines, settled below them, Marlin is in the downward trend zone. We are waiting for the price at the first target of 1.1170.
*The market analysis posted here is meant to increase your awareness, but not to give instructions to make a trade.
Analysis are provided by InstaForex
-
05-01-22, 07:06 #1618
Veteran Member
Just starting here
- Join Date
- Jun 2013
- Age
- 38
- Posts
- 4,044
- Rep Power
- 0
Forex Analysis & Reviews: Forecast for EUR/USD on January 5, 2022
Yesterday's trading range for the euro was 51 points. With its upper shadow, the price tried to reach the resistance of the MACD line, while it ended the day under the balance indicator line with a black candle. Now the price has actually settled below both indicator lines. The Marlin Oscillator approached the zero line and is preparing to move into the negative zone. When it does this, the price will be completely in a downward position. The target of the movement is 1.1170. Overcoming the level opens the second target at 1.1050.
The price also tried to rise above the MACD line on the four-hour chart; it succeeded, but for a very short time. At the same time, another signal has appeared for the bears - a price reversal to the downside after an unsuccessful attack on resistance. The Marlin Oscillator is in negative territory, the general trend is downward.
*The market analysis posted here is meant to increase your awareness, but not to give instructions to make a trade.
Analysis are provided by InstaForex
-
06-01-22, 06:47 #1619
Veteran Member
Just starting here
- Join Date
- Jun 2013
- Age
- 38
- Posts
- 4,044
- Rep Power
- 0
Forex Analysis & Reviews: Forecast for AUD/USD on January 6, 2022
Yesterday, the Australian dollar retested the daily MACD indicator line (arrow) and sharply fell below the target level of 0.7227. This retest became a confirmation of the strength of the MACD line and an additional sign of further price movement down to the target levels of 0.7065 and 0.7007. The final confirmation of the aussie's development under this scenario will be the price drift below the target level of 0.7171 (September 29, 2021 low). The price drift below this level will probably occur simultaneously with the transition of the Marlin Oscillator to the zone of negative numbers. This synchronicity will strengthen the bearish signal.
On a four-hour chart, the price is completely in a downward trend. Its development takes place under both indicator lines and the Marlin Oscillator goes down in the negative area. Yesterday the price made a false exit above the MACD indicator line and now the downward sentiment of AUD/USD is strengthening.
*The market analysis posted here is meant to increase your awareness, but not to give instructions to make a trade.
Analysis are provided by InstaForex
-
07-01-22, 05:25 #1620
Veteran Member
Just starting here
- Join Date
- Jun 2013
- Age
- 38
- Posts
- 4,044
- Rep Power
- 0
Forex Analysis & Reviews: Forecast for EUR/USD on January 7, 2022
The euro slightly fell last Thursday, consolidating ahead of today's US employment data. The forecast is very optimistic: 400,000 new jobs are expected in the non-agricultural sector in December, the unemployment rate may decrease from 4.2% to 4.1%.
The price settled below the MACD indicator line on the daily chart, the Marlin Oscillator is still hesitating to cross the border with the bears' territory. This will probably happen if the data is not very different from the forecast for the worse - weekly applications for unemployment benefits in the last month came out flat and, we believe, non-farms will also be in the forecast area. As a result, we expect the euro to decline in the next few days to the target level of 1.1170 - to the support area of June 2020.
The price also settled below the MACD line on the four-hour scale, the Marlin Oscillator is already in the negative area. There is pressure on the price, we are waiting for the resolution of the situation with the release of news.
The alternative scenario assumes the price settling above the level of 1.1310 and further growth to the upper border of the 1.5-month range at 1.1222-1.1383.
*The market analysis posted here is meant to increase your awareness, but not to give instructions to make a trade.
Analysis are provided by InstaForex

 Reply With Quote
Similar Threads
-
Forex News from InstaForex
By InstaForex Gertrude in forum Advertisement PlaceReplies: 2103Last Post: 16-02-24, 09:27 -
Forex Technical & Market Analysis FXCC
By alayoua in forum Advertisement PlaceReplies: 4Last Post: 06-07-16, 23:25 -
Weekly technical analysis for 3 - 7.12, 2012
By bellalca in forum Affiliate program networksReplies: 0Last Post: 04-12-12, 06:09


Bookmarks